Project Management Report – 5 Essential reports for Efficient Project Management
What is a Project Management Report?
A project management report is a structured document that presents key details about a project’s progress, risks, and performance metrics. It helps project managers and stakeholders assess project health, identify issues, and ensure successful delivery.
Key Purposes of a Project Management Report
- Progress Tracking: Measures milestones, deliverables, and project timelines.
- Risk Assessment: Identifies potential risks and mitigation strategies.
- Stakeholder Communication: Keeps executives, clients, and teams informed.
- Resource Management: Optimizes workforce and budget allocations.
- Decision-Making: Provides insights for strategic planning and corrective actions.
Need for a Project Management Report
Project management reports are essential for:
- Ensuring project transparency: Reports provide a clear picture of a project’s status and help maintain accountability.
- Improving risk management: Early detection of project risks allows for proactive mitigation strategies.
- Facilitating stakeholder engagement: Regular reports keep stakeholders updated, reducing misunderstandings.
- Enhancing efficiency: Well-structured reports help teams prioritize tasks and optimize resource allocation.
Key Statistics Related to Project Management Reporting
- 58% of organizations report that project reporting improves decision-making.
- 80% of high-performing projects utilize project management reporting tools.
- Poor reporting practices contribute to project failure in 32% of cases.
- Organizations using automated project reports experience a 30% increase in on-time project completion.

Challenges in Conventional Project Management Reporting
Traditional project reporting often faces several challenges:
| Challenge | Impact |
|---|---|
| Manual data entry | Increases errors and slows down reporting |
| Lack of real-time updates | Delays decision-making and risk mitigation |
| Poor data visualization | Makes it difficult to interpret insights |
| Inconsistent reporting formats | Leads to confusion and inefficiencies |
| Limited collaboration | Hinders communication across teams |
Types of Project Management Reports
1. Project Management Status Report
Purpose:
A project management status report provides a snapshot of the current progress of the project. It highlights completed tasks, ongoing activities, upcoming milestones, and any roadblocks that need attention. This report is crucial for keeping stakeholders informed and ensuring project alignment with the original plan.
Key Components:
- Project name and reporting period
- Overall project status (On track, At risk, Delayed)
- Completed tasks and milestones
- Pending tasks and upcoming deadlines
- Issues and challenges encountered
- Recommendations and next steps
Project Management Status Report Template:
| Project Name: [Insert Project Name] | Report Date: [MM/DD/YYYY] |
|---|---|
| Project Manager: [Insert Name] | Project Status: [On track/At risk/Delayed] |
| Completed Milestones | Pending Tasks |
| [Milestone 1] – [Date] | [Task 1] – [Due Date] |
| [Milestone 2] – [Date] | [Task 2] – [Due Date] |
| Issues and Challenges | Recommended Actions |
| [Issue 1] – [Impact] | [Solution 1] |
| [Issue 2] – [Impact] | [Solution 2] |
2. Project Risk Report
Purpose:
A project risk report identifies potential risks that could impact project success. It provides an assessment of risk levels, possible consequences, and recommended mitigation strategies. This report helps project managers prepare contingency plans and avoid project disruptions.
Key Components:
- List of identified risks
- Risk probability (Low, Medium, High)
- Potential impact (Minor, Moderate, Critical)
- Mitigation strategies and action plans
- Responsible personnel for risk management
Project Risk Report Template:
| Risk ID | Risk Description | Probability | Impact | Mitigation Strategy | Owner |
|---|---|---|---|---|---|
| R1 | Scope creep due to evolving requirements | High | Critical | Define clear scope; get approvals in writing | Project Manager |
| R2 | Resource shortages | Medium | Moderate | Reallocate resources and adjust timelines | HR Lead |
| R3 | Budget overruns | High | Critical | Regular financial reviews and reallocation | Finance Team |
3. Budget Report
Purpose:
A budget report tracks the financial health of a project by monitoring planned versus actual expenses. It ensures that the project stays within budget and highlights any financial risks.
Key Components:
- Total project budget
- Estimated vs. actual costs
- Cost variances
- Justifications for overruns
- Forecasted financial requirements
Budget Report Template:
| Expense Category | Planned Budget ($) | Actual Cost ($) | Variance ($) | Remarks |
|---|---|---|---|---|
| Software Licenses | 10,000 | 9,500 | -500 | Under budget |
| Equipment | 15,000 | 17,000 | +2,000 | Over budget due to upgrades |
| Employee Salaries | 50,000 | 50,000 | 0 | On track |
| Miscellaneous | 5,000 | 4,800 | -200 | Under budget |
| Total | 80,000 | 81,300 | +1,300 | Slight overrun |
4. Resource Utilization Report
Purpose:
A resource utilization report helps project managers monitor workforce efficiency and workload distribution. It ensures that employees are neither overburdened nor underutilized and helps in optimizing team performance.
Key Components:
- Employee/task assignments
- Workload distribution
- Availability of resources
- Productivity metrics
- Adjustments needed to improve efficiency
Resource Utilization Report Template:
| Employee Name | Role | Assigned Tasks | Hours Worked | Utilization Rate (%) |
|---|---|---|---|---|
| John Doe | Software Developer | Task A, Task B | 40 | 90% |
| Jane Smith | Designer | Task C | 35 | 75% |
| Tom Brown | Project Manager | Task D, Task E | 50 | 100% |
| Emily Davis | QA Engineer | Task F | 30 | 60% |
5. Project Closure Report
Purpose:
A project closure report evaluates the overall success of a project upon completion. It documents achievements, lessons learned, and recommendations for future projects. This report serves as a final assessment of project deliverables.
Key Components:
- Project objectives and final outcomes
- Success criteria and performance assessment
- Challenges faced and how they were resolved
- Lessons learned
- Recommendations for future projects
Project Closure Report Template:
| Project Name: [Insert Project Name] | Completion Date: [MM/DD/YYYY] |
|---|---|
| Project Manager: [Insert Name] | Final Status: [Completed/Partially Completed/Failed] |
| Objectives Achieved | Challenges Faced |
| [Objective 1] – [Outcome] | [Challenge 1] – [Impact] |
| [Objective 2] – [Outcome] | [Challenge 2] – [Impact] |
| Lessons Learned | Recommendations for Future Projects |
| [Lesson 1] | [Recommendation 1] |
| [Lesson 2] | [Recommendation 2] |
Components of a Project Management Report
A well-structured project report should include:
1. Project Overview
Purpose:
The project overview provides a concise summary of the project, offering key details that help stakeholders quickly understand its objectives, scope, and current status.
Key Components:
Project Name – Clearly state the name of the project.
Project Manager – Mention the person responsible for overseeing the project.
Start and End Dates – Indicate the planned timeline for the project.
Project Objectives – Outline the primary goals the project aims to achieve.
Project Scope – Define the boundaries of the project, including deliverables and limitations.
Stakeholders Involved – List the key individuals or teams involved in the project.
Example Format:
| Project Name | Digital Transformation Initiative |
|---|---|
Project Manager | John Doe |
Start Date | Jan 1, 2025 |
End Date | Dec 31, 2025 |
Project Objective | Implement cloud-based solutions to enhance operational efficiency |
Scope | Migrating existing IT infrastructure to the cloud |
2. Project Timeline
Purpose:
A project timeline visually represents the progress of tasks, milestones, and deadlines. This section helps project managers track whether the project is on schedule and identify any potential delays.
Key Components:
Project Phases – Breakdown of major stages in the project lifecycle.
Milestones Achieved – Significant checkpoints that have been completed.
Upcoming Milestones – Key deliverables that are due soon.
Delays and Adjustments – Explanation of any schedule changes.
Example Format:
| Milestone | Planned Completion | Actual Completion | Status |
|---|---|---|---|
Jan 5, 2025 | Jan 5, 2025 | ✅ Completed | |
Requirement Analysis | Feb 10, 2025 | Feb 15, 2025 | ⚠ Delayed |
System Development | May 30, 2025 | Pending | ⏳ In Progress |
3. Performance Metrics
Purpose:
This section highlights measurable indicators that assess the project’s health, efficiency, and success. Performance metrics help track progress, identify bottlenecks, and ensure that the project remains aligned with business objectives.
Key Components:
Budget Utilization – Percentage of the budget spent vs. remaining.
Task Completion Rate – Number of completed tasks compared to planned ones.
Resource Allocation – Usage of manpower and assets.
Risk Assessment – Evaluation of project risks and mitigation efforts.
Example Format:
| Metric | Planned Value | Actual Value | Variance |
|---|---|---|---|
| Budget Utilization | $100,000 | $90,000 | -10% (Under Budget) |
Task Completion Rate | 70% | 60% | -10% (Behind Schedule) |
Risk Score (1-10) | 3 | 5 | High Risk Identified |
4. Challenges & Risks
Purpose:
This section identifies potential or existing obstacles that could impact the project’s success. By documenting risks early, project teams can develop strategies to mitigate or resolve them effectively.
Key Components:
Technical Challenges – Issues related to technology, tools, or system integration.
Resource Constraints – Shortages of manpower, budget, or infrastructure.
Stakeholder Concerns – Conflicts or misalignment between project teams and stakeholders.
Risk Mitigation Plan – Strategies to address or prevent risks.
Example Format:
Challenge/Risk | Impact | Mitigation Strategy | Owner |
Delayed system testing | High | Allocate additional testing resources | QA Lead |
Budget overrun risk | Medium | Identify cost-saving opportunities | Finance Team |
Employee resistance to change | High | Conduct training and change management | HR Team |
5. Recommendations & Next Steps
Purpose:
This section outlines actionable insights that help ensure the project stays on track or improves performance. Recommendations should be specific, practical, and aligned with the project’s objectives.
Key Components:
Immediate Action Items – Tasks that need urgent attention.
Process Improvements – Suggestions for optimizing workflows and efficiency.
Future Enhancements – Long-term strategies to improve project outcomes.
Responsible Teams – Assign roles for implementation.
Example Format:
Recommendation | Action Required | Responsible Team | Deadline |
Improve testing efficiency | Implement automated testing tools | QA Team | April 2025 |
Control budget utilization | Review vendor contracts for cost savings | Finance Team | May 2025 |
Strengthen communication | Use collaboration software for real-time updates | Project Management | March 2025 |
Automating Project Management Reporting
Project management reporting has traditionally been a manual and time-consuming task, often leading to errors, inconsistencies, and inefficiencies. However, automation has revolutionized this process by streamlining data collection, ensuring accuracy, and enhancing real-time tracking of project progress. With modern project management reporting tools, teams can generate detailed, data-driven reports effortlessly, reducing the workload on project managers while improving decision-making.
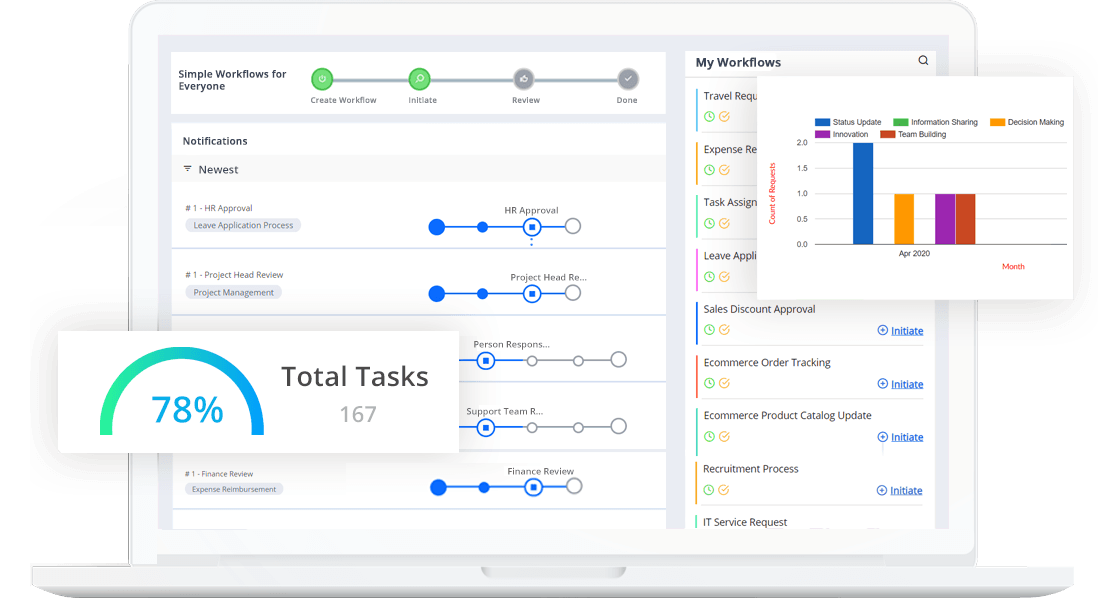
Automation enables organizations to shift from static, outdated reports to dynamic, real-time dashboards that provide actionable insights. Instead of manually compiling information from different sources, project managers can rely on automated systems to extract data, analyze trends, and present critical metrics through intuitive dashboards. These tools improve collaboration, increase productivity, and allow teams to focus on strategic initiatives rather than administrative tasks.
By leveraging workflow automation, companies can eliminate redundant reporting steps, minimize human errors, and gain better visibility into project performance. Below are some key ways automation enhances project reporting.
How Automation Enhances Project Reporting
1. Real-time Data Access
Traditional project reports often suffer from delays because data is manually gathered, processed, and formatted before being shared. Automated project reporting ensures that reports are always up-to-date by pulling information directly from integrated systems. Real-time dashboards provide instant visibility into project progress, resource utilization, budget consumption, and potential risks, enabling faster decision-making.
2. Error Reduction
Manual data entry increases the risk of human errors, leading to inaccurate reports, miscalculations, and faulty project insights. Automated reporting tools eliminate this risk by pulling data directly from reliable sources such as enterprise resource planning (ERP) systems, project management software, and financial databases. Automation reduces misreporting, ensuring project stakeholders receive accurate and consistent information.
3. Customizable Dashboards for Visual Reporting
Data visualization plays a crucial role in effective project management reporting. Automated tools offer customizable dashboards that present key performance indicators (KPIs), task progress, risk factors, and financial summaries in a visually intuitive manner. Interactive charts, graphs, and heatmaps make it easier for teams to analyze trends and identify potential bottlenecks. Unlike static reports, dynamic dashboards allow stakeholders to filter, drill down, and view data from different perspectives.
4. Time Efficiency and Productivity Gains
Preparing manual reports requires significant effort, from gathering data and verifying information to formatting and distributing reports. Automation significantly reduces the time spent on these tasks by auto-generating reports at predefined intervals. This allows project managers to focus on strategy, team coordination, and risk management, rather than spending hours compiling reports.
5. Seamless Integration with Other Tools
Modern project management reporting tools integrate with existing software ecosystems, enabling seamless data flow across task management platforms, financial software, CRMs, and collaboration tools. This ensures that all project data is captured in one place, eliminating silos and improving visibility. Integration with automation solutions like Cflow further enhances efficiency by streamlining approval workflows, data collection, and report distribution.
Key Benefits of Automating Project Management Reporting
| Benefit | Impact |
|---|---|
| Faster Report Generation | Saves time for project managers |
| Improved Accuracy | Minimizes human errors |
| Enhanced Collaboration | Keeps all teams aligned with real-time updates |
| Better Decision-Making | Data-driven insights for proactive planning |
| Regulatory Compliance | Ensures adherence to industry standards |
Cflow and Project Management Reporting
Cflow, a leading no-code workflow automation tool, simplifies project reporting with its advanced features:
- Visual Workflow Builder: Enables easy process automation for project reports.
- Drag-and-Drop Form Designer: Customizes reports with relevant project data.
- OCR for Data Extraction: Automates data collection from multiple sources.
- Integration Capabilities: Connects with project management tools for seamless reporting.
- Mobile Accessibility: Allows report tracking on the go.
- Kanban Boards: Provides a visual representation of project tasks and progress.
Final Thoughts
A project management report is crucial for tracking progress, managing risks, and ensuring project success. Traditional reporting methods are time-consuming and prone to errors, making automated project management reporting tools essential for efficiency and accuracy.
By leveraging workflow automation solutions like Cflow, organizations can streamline project reporting, enhance collaboration, and improve decision-making. Try Cflow today to simplify your project management reports and drive better project outcomes!
FAQs
1. What should be included in a project management status report?
A project management status report should include project objectives, current progress, risks, financial status, upcoming milestones, and key recommendations.
2. What are the best project management reporting tools?
Top project reporting tools include Cflow, Asana, Monday.com, Trello, Jira, and Smartsheet, which offer automation, real-time tracking, and customizable reports.
3. How often should project reports be generated?
Project reports can be generated weekly, bi-weekly, or monthly, depending on the project’s complexity and stakeholder requirements.
4. How does automation improve project management reporting?
Automation improves data accuracy, report consistency, and time efficiency by eliminating manual errors and providing real-time project insights.
5. What is the difference between project reporting and project tracking?
Project tracking monitors real-time progress, while project reporting compiles and presents structured insights for stakeholders.
What should you do next?
Thanks for reading till the end. Here are 3 ways we can help you automate your business:

Do better workflow automation with Cflow
Create workflows with multiple steps, parallel reviewals. auto approvals, public forms, etc. to save time and cost.

Talk to a workflow expert
Get a 30-min. free consultation with our Workflow expert to optimize your daily tasks.

Get smarter with our workflow resources
Explore our workflow automation blogs, ebooks, and other resources to master workflow automation.